Overview
Module: Sonarr & Radarr
Activity type: Reading (Learn)
Objective: Explain why a running Radarr process does not prove that movie automation is working
Vocabulary
| Term | Meaning |
|---|---|
| Availability | The proportion of intended observations during which a service satisfies a defined success condition. |
| Liveness | Evidence that a process or service is running and can respond at a basic level. |
| Readiness | Evidence that a service is prepared to perform useful work, including access to required dependencies. |
| Synthetic probe | An automated request that tests a service from the perspective of a client. |
| Dependency health | The operational state of systems Radarr relies on, such as indexers, download clients, storage, DNS, and databases. |
| Timeout | A client-defined limit after which an incomplete operation is treated as a failure. |
| Latency | The elapsed time between initiating a request and receiving its result. |
| False positive | An alert that reports an outage or defect when the monitored service is functioning acceptably. |
| End-to-end check | A test that validates a complete user or automation workflow rather than one isolated component. |
Instruction
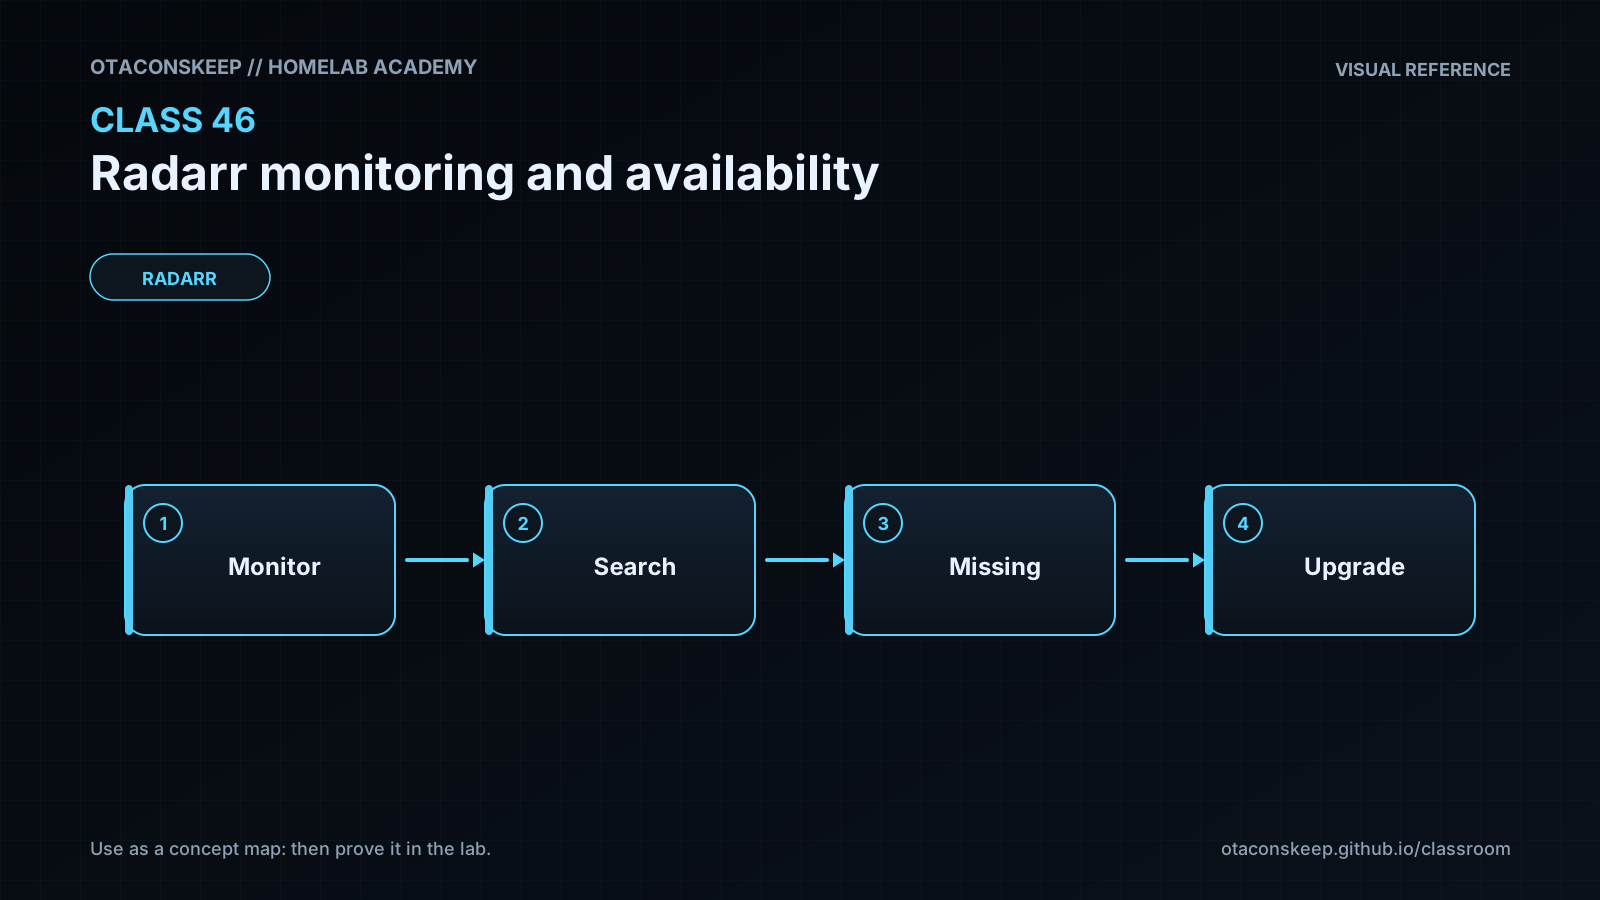
Monitoring Radarr requires more than checking whether its process exists. A process check only establishes that the operating system still has a Radarr process. A port check adds evidence that something is accepting connections, while an HTTP check confirms that an application-level response can be received. Even a successful HTTP response does not prove that Radarr can query an indexer, submit a download, import a completed file, write to the movie library, or reach its database and download client. Good monitoring therefore uses layers. The first layer checks host and process liveness. The second checks local HTTP reachability. The third evaluates Radarr health information and application logs. The fourth checks critical dependencies. The final layer verifies a safe end-to-end workflow or a close approximation of one.
Every availability measurement must define success. For this lesson, a probe succeeds when the local service returns HTTP 200 within the probe timeout. The lab also applies a 500 millisecond latency policy to demonstrate how a reachable service may still violate an operator-defined objective. This value is a classroom policy, not a universal Radarr performance benchmark. Production thresholds should be based on normal observed behavior, user impact, storage characteristics, network placement, and the frequency of the check.
A monitor should record enough context to explain a failure: observation time, target, HTTP status, elapsed time, exception category, and the number of successful attempts. Repeated attempts can reduce alerts caused by a single transient event, but retries also delay detection. Alert rules should generally require more than one failed observation and should include a recovery notification. Avoid hiding persistent defects behind unlimited retries.
Radarr may remain reachable while reporting degraded dependency health. An unavailable indexer can prevent searches, a failed download client can prevent queue submission, and an unwritable library path can prevent imports. These conditions should not all be labeled identically. Separate alerts allow an operator to route and prioritize incidents correctly. A local HTTP failure may justify an application availability alert, while one failed indexer may justify a dependency warning. An end-to-end import failure is more consequential because it proves the automation path is broken.
Monitor placement also matters. A probe running on the same host validates the application and loopback network path but cannot detect every reverse-proxy, DNS, routing, or client-network failure. A second probe from another trusted system tests more of the real access path. Production monitoring should avoid exposing administrative interfaces solely to make probing easier. Monitoring requests should use the least privilege available, protect authentication material outside scripts and reports, and prevent sensitive headers or query data from appearing in logs. The laboratory avoids those concerns by using an unauthenticated mock service bound only to 127.0.0.1.
Architecture
The laboratory architecture consists of a Python mock service bound to 127.0.0.1:8787, a state file under /opt/lab-classroom/class46/, and a Python synthetic monitor. The mock service reads state.txt for each request. In the available state it returns HTTP 200 with a small JSON document. In the unavailable state it returns HTTP 503. In the slow state it delays the response before returning HTTP 200. The monitor performs three observations, records status and latency, calculates observed availability, writes report.json, and exits unsuccessfully if any observation fails or if the maximum observed latency exceeds the classroom policy. In production, the equivalent design would combine a host or container check, an HTTP probe, Radarr health observations, dependency checks for indexers and download clients, storage checks, and monitoring from a trusted remote location.
Required reading
- Radarr Wiki: System and health-check documentation at https://wiki.servarr.com/radarr
- Prometheus documentation: Instrumentation practices at https://prometheus.io/docs/practices/instrumentation/
- IETF RFC 9110: HTTP Semantics at https://www.rfc-editor.org/rfc/rfc9110
- Python documentation: urllib.request at https://docs.python.org/3/library/urllib.request.html
References
- Radarr project documentation: https://wiki.servarr.com/radarr
- Radarr source repository: https://github.com/Radarr/Radarr
- Prometheus instrumentation practices: https://prometheus.io/docs/practices/instrumentation/
- Prometheus alerting practices: https://prometheus.io/docs/practices/alerting/
- IETF RFC 9110, HTTP Semantics: https://www.rfc-editor.org/rfc/rfc9110
- Python urllib.request documentation: https://docs.python.org/3/library/urllib.request.html
- Python http.server documentation: https://docs.python.org/3/library/http.server.html